It’s that time of year. Assuming the fiscal year of July through June and an academic year of fall semester through summer semester, now is the time to assess mid-year progress of annual goals. This year, as I put a mid-year report together and started thinking of the year-end report, I decided it was time for some improvements on our mid-year and annual reports.
When it comes to reporting on my department and program areas, my passion for what we do, what we’ve accomplished, and how it’s impacting our students can quickly turn into too many pages and long narratives. While interesting to me, is anyone else really reading it with the same interest and passion? With today’s dwindling attention spans and our culture of sound bites and multimedia content, is the multipage, bullet by bullet strategic plan outcome narrative report style still relevant? This is my struggle that has prompted reflection on a different approach.
Know Your Audience
I realized I have two main audiences to whom my department submits reports: Student Government and our division. While some information is the same, the audience really dictates the content. Other audiences may include donors/stakeholder or possibly a general web audience if your report is posted for public viewing online. Knowing your audience allows you to define and customize the report criteria.
Define the Reporting Criteria: Know What They Want
Distinguishing my audiences helped me better define the report content.
Reports to Student Government include data on the impact of programs and services on students and include:
- Usage, total and unique participants.
- Program highlights.
- Budget highlights, like showcasing new equipment.
These report ranges are broken up by semester and can be summarized with school year totals. Criteria is reported per unit — aquatics, competitive sports, fitness, outdoor adventure, wellness, etc. — and sometimes unit stats are combined to represent department totals.
Reports to our division are based off our department’s achievement of goals and objectives as set out in the strategic plan. While the strategic plan may overlap with the student government report criteria mentioned above, reporting on goals and objectives is often broader than any single program or use statistic.
Convey Experiences
Pictures and testimonials can bring student experiences to life and give more weight to the words on the page. Putting out quality, engaging programming is what we do and there is so much that can be said about each of our units to really showcase all they do. This is where I run into trouble on the word count and lengthy narratives. I’m now applying the old adage “a picture is worth a thousand words” and letting a picture with an informative caption or concise stats next to it do the talking.
This is an example of a photo and overview used in a recent report to Student Government about our student expedition program.

Make It Easy
With the reporting process mapped out to know the audience, define the reporting criteria and convey experiences, here’s my approach to making it easier each time.
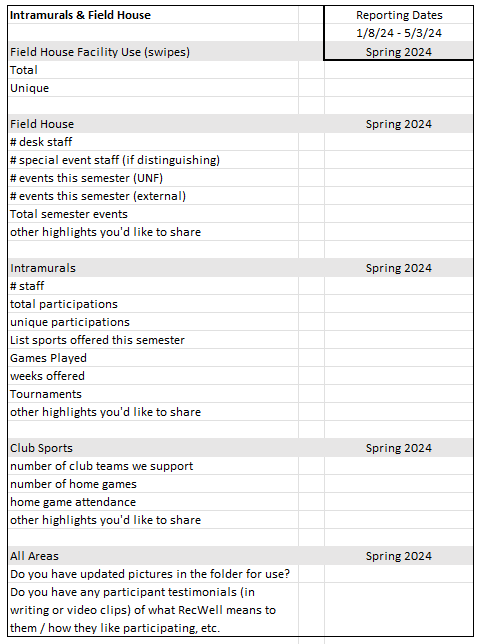
Use a template. Our department collects a variety of statistics and data about our programs, participants and facility use. When it comes to reporting, every data point may not be useful. It’s important to note I’m not collecting the data on each of our programs, so each of our reporting areas has a template of the statistics and data to collect each semester to ensure consistency in reporting from year to year.
Even without a specific template, collecting stats and data is pretty routine. One game-changer to the template is a line item for current pictures and student testimonials to make sure I have content to help convey the experiences and bring more life into the report.
With this mid-year reflection and tweaks to my reporting processes, I am looking forward to applying these strategies in this year’s annual report.

Heather Kite
Heather Kite is the director for operations in the Recreation and Wellness Department at the University of North Florida. She got her start in campus recreation as a student lifeguard and swim instructor during her undergraduate studies and was hired into the aquatic program coordinator position. This footing in aquatics and risk management opened up doors for growth into operations and she now oversees the department business office, Competitive Sports, Eco Adventure, and Aquatics units and still uses her American Red Cross Lifeguard and Water Safety Instructor-Trainer certifications to support department staff instructor training. Connect with Heather on LinkedIn.


